See Why NEM Prices Spike
The only weather-first analytics dashboard for Australia's National Electricity Market. No install. No enterprise contract. Just answers.
Free plan includes NSW with 7-day history. No credit card required.
Built for energy traders, renewable operators, and analysts across the NEM
Weather Drives the NEM.
Your Tools Don't Show It.
Price spikes cost you money — but your dashboard doesn't tell you why they happened.
Enterprise tools like ez2view and NemSight cost thousands per seat and need IT to install.
You're left manually cross-referencing BOM weather data with AEMO price data in spreadsheets.
Weather-First NEM Intelligence
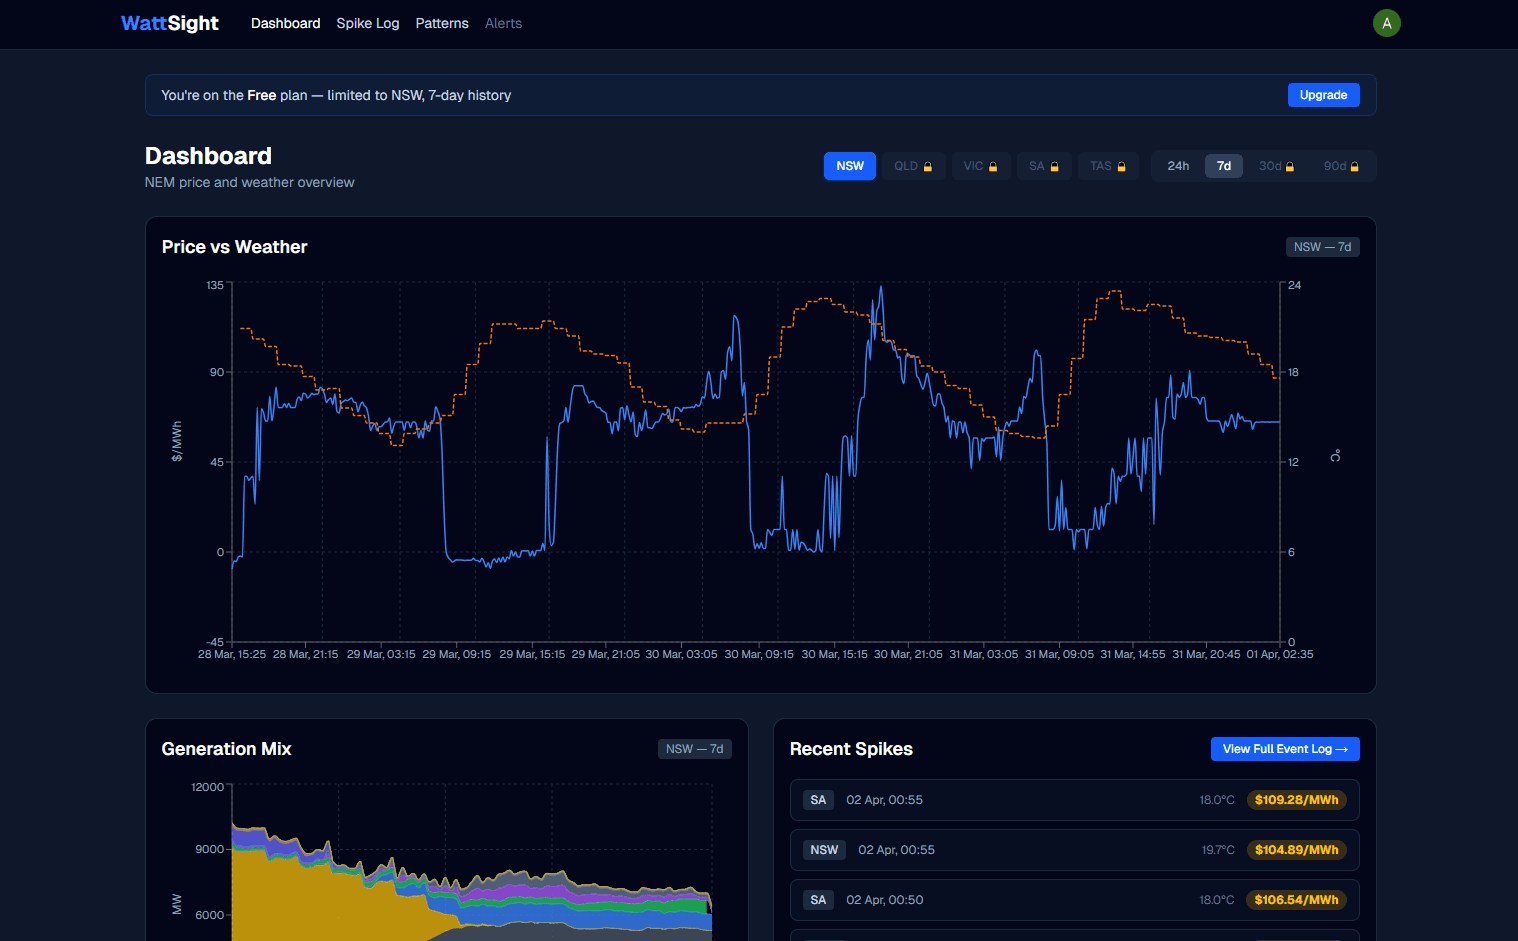
We don't just show market data with weather on the side. We answer the question “why did prices spike?” with weather as the explanatory variable.
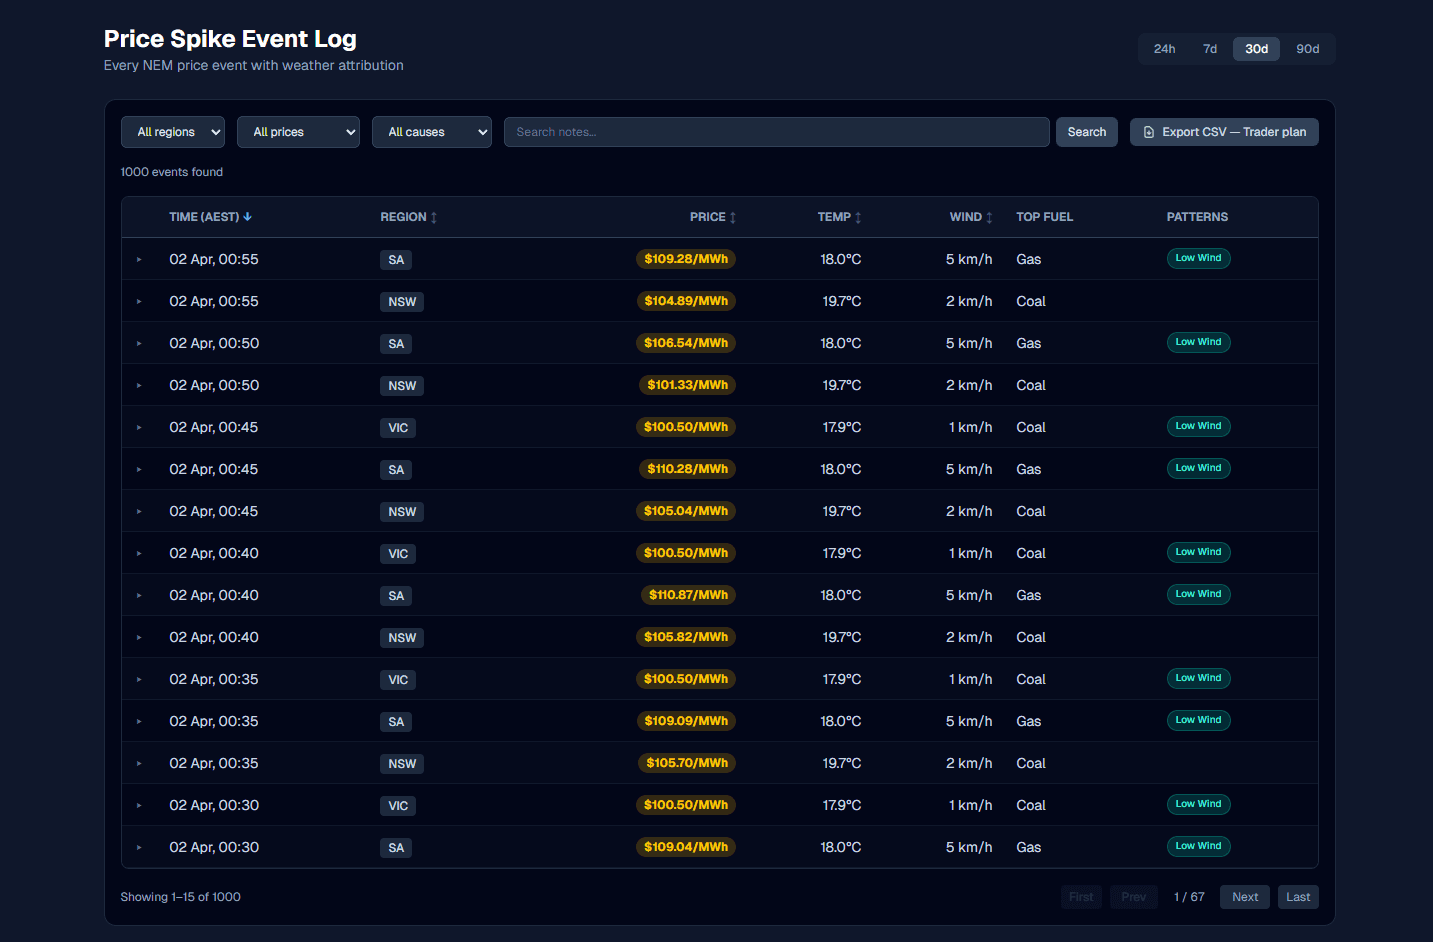
Weather Attribution Event Log
Every price spike auto-tagged with the weather conditions that caused it. Filter by region, severity, or weather type. Export to CSV for your reports.
Pattern Search
Ask questions like “show me every time wind dropped below 12 km/h in SA” and see what happened to prices. Spot the patterns that cost you money.
Price-Weather Overlay
Dual-axis charts showing NEM spot prices alongside temperature, wind speed, solar irradiance, and cloud cover. See the correlation in real time.
How WattSight Compares
The affordable, web-based alternative to enterprise NEM tools.
| Feature | WattSight | Enterprise Tools |
|---|---|---|
| Price | From $149/mo | $5,000–$15,000+/yr |
| Access | Web browser, any device | Windows desktop app |
| Setup | Sign up, start using | IT install + onboarding |
| Weather focus | Weather-first attribution | Market-first with weather overlay |
| Pattern search | “Show me every time X happened” | Manual chart analysis |
| CSV export | One-click | Varies |
Simple, Transparent Pricing
Start free. Upgrade when you need more regions or features.
Free
Get started with NSW data
Get Started Free- NSW region only
- 7-day history
- Price-weather charts
- Spike event log
- CSV export
- Pattern search
- Email alerts
Trader
For active NEM traders
Upgrade to Trader- All 5 NEM regions
- 90-day history
- Price-weather charts
- Spike event log
- CSV export
- Email alerts
- Pattern search
Pro
For desks and asset operators
Contact Sales- Everything in Trader
- Full history
- Pattern search
- API access
- Custom alert rules
- Team seats (up to 5)
2 months free on annual billing. Enterprise plans available — contact us.
Stop guessing why prices spiked.
Start seeing the weather behind every move.
Start FreeNo credit card required. Free plan available.